Median Income in Relation to
Child Density in Tacoma, Washington

Under the longstanding Demographics Transition theory, it is known that birth rates are high when associated with low income, but begin to decrease with economic growth (Blanchet, 1991). Tacoma, WA has a wide range of income throughout its census block groups. This research attempts to visualize the relationship between economics and child density in the city, hypothesizing that higher income neighborhoods will have lower densities of children than lower income neighborhoods. The median was chosen as the income parameter due to its greater accuracy than using the mean when dealing with income.


Figure 1
Preliminary Arrangements
Initial steps were taken to create an appropriate Tacoma boundary from the 2017 Tacoma neighborhoods layer (fig. 1). This involved dissolving the layer, creating a topology, and editing in order to align edges of error gaps left after the dissolve process, then finally exporting the boundary as a new layer (fig. 2).
Figure 2
Using a previously joined layer of Pierce County census block centroids with child density information from 2010, a new centroids layer was clipped to the Tacoma boundary (fig. 3) and then interpolated through the IDW method with cell size 20 and a processing/raster analysis extent of Tacoma to create a raster surface of child density in Tacoma (fig. 4).
Interpolations


This same interpolation method was then applied to 2012 income data taken from the US Census website after it was joined to block groups, clipped to Tacoma, and converted to points data (fig. 5). This created the median income raster layer (fig. 6).
Figure 3: Child density points by block
Figure 4: Child density raster
Figure 5: Median income points by block group
Figure 6: Median income raster

Figure 7: Child density raster in 3-D with Tacoma streets

Three-Dimensional Aspects
ArcScene was used to create three-dimensional maps using the interpolated raster layers and Tacoma streets (figs. 7, 8). Tacoma neighborhoods were initially layered as well, but processing limitations rendered them unusable in the 3-D setting. Base heights were set to floating on a custom surface respective to the median income raster and the child density raster, with cell size X and Y resolution set each to 20 and symbolized as stretched using standard deviation and n=2.
Figure 8: Median income raster in 3-D with Tacoma streets
Two-Dimensional Counterparts
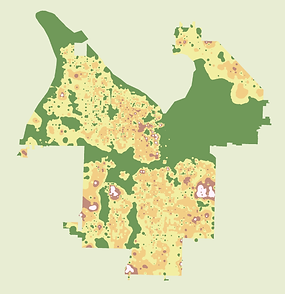
The two-dimensional maps were symbolized according to their 3-D counterparts and adding the Tacoma neighborhoods layer (figs. 9, 10).


Figure 9: Child density raster with Tacoma streets and neighborhoods
Figure 10: Median income raster with Tacoma streets and neighborhoods
Results and Conclusions
As suspected, the higher median income areas are in line with areas of lower child densities, whereas lower income areas coincide with high densities of children. Other than a few concentrated spots, most of the high income areas are in the northern neighborhoods of Tacoma, while the lower income areas are central and to the south. The latter areas are also where increased child densities occur, reaching up to 13,200 children per square mile. Understandably, lower income areas would have more multi-family housing, which contributes to the higher child densities. Additionally, there are generally more lower income people than there are people with higher incomes, thus it follows that child densities would be higher in the lower income areas. These results correlate in line with the hypothesis, at least in Tacoma, WA. It must be noted, however, that these results were found using data from 2010 and 2012, and therefore are not completely current.
PDF Poster

Created by Anna McDermott
9 April 2017
ArcMap & ArcScene 10.4.1
Projection: NAD 1983 HARN State Plane Washington South FIPS 4602 Feet
Sources: Lab 6 Data, Lab 4 Data, US Census Bureau
Reference: Blanchet, D. (1991) 'On Interpreting Observed Relationships Between Population Growth and Economic Growth: A Graphical Exposition', Population and Development Review 17(1): 105-14.